This is a sequel to an earlier comic, 1939: 2016 Election Map. The United States elects its president not directly by popular vote but by an Electoral College composed of a number of electors, partially proportional to population, from each state. Presently, a "winner-take-all" system is used in most states: the winner of the popular vote in each state receives all of the electoral votes for that state. Though, strictly speaking, the electors are not required to cast their ballots according to this system, many states impose penalties on them if they don't. Technically, the popular vote in each state is to elect a slate of electors who in turn elect the President.
During the election season, news outlets and other political trackers tend to color-code each state with the party which won the state (or which is projected or speculated to win). Since the 2000 election it's become common practice to code Republican victories as red and Democratic victories as blue. Other parties have less consistent colors, but are commonly green. These colors have become embedded in popular vernacular, as states that are heavily Republican are known as "red states" and those that are heavily Democratic are known as "blue states".
These graphics can be misleading as to the realities on the ground, though. Because each state is colored solidly red or blue, it gives the impression that each state belongs entirely to one party or the other, when the color could represent a very slender minority, or an overwhelming advantage. In addition, such a graphical view means that larger states translate to more area of a given color, giving the impression of party strength, even though that may not represent many voters. In the US, large cities trend largely Democratic, while rural areas trend largely Republican. This means that many Democratic voters are concentrated in relatively small urban areas, so a large "red" state may represent fewer voters than a small "blue" state.
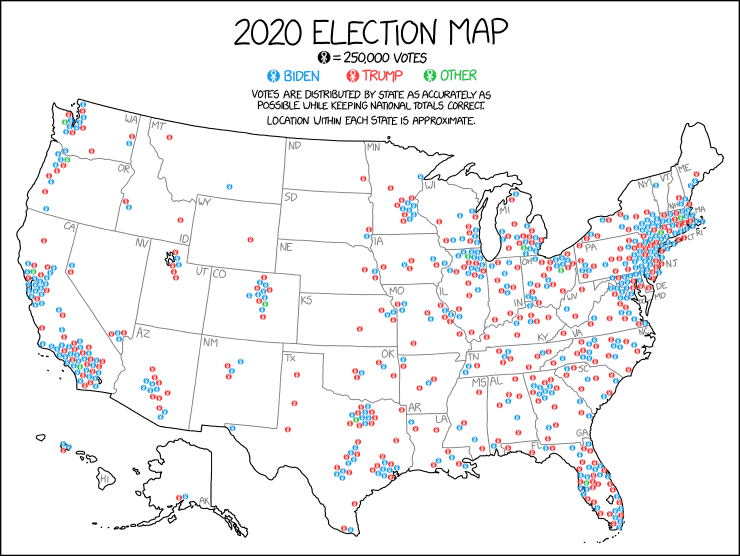
Randall's solution to this is to represent the Republican and Democratic voters in each state with Cueball icons, each icon representing 250,000 voters. He has made some attempt to distribute the Cueball icons within a state in a manner similar to how the actual votes were distributed. This has the advantage of giving a decent impression of how popular each candidate was, how their popularity varied across the country, and how the votes were distributed by both state and region. It also gives at least a basic indication of population patterns in the US, with large regions that are sparsely inhabited, and populations clustered in urban centers.
The title text compares different voter pools in terms of absolute size. These facts are frequently counter-intuitive. California is generally thought of as a "blue state", and Texas as a "red state" (Although that may be changing), so it's surprising to realize that, in 2020, Donald Trump received more votes in California than he did in Texas. The reason for this is not complex, California has a huge population, nearly 40 million people, of whom 17.5 million voted in 2020. Even though Joe Biden won the state easily, Trump received 6 million of those votes. Texas, by contrast, has 27.7 million residents and 11.3 million voters in the 2020 election. Trump received 5.9 million of those votes, which was enough to win the state. Because of the huge variation in population among US states, and the political divisions within each state, there are multiple "blue" states which have more Republican voters that at least some "red" states, and vice versa. This underscores the importance of not viewing any state as politically uniform. Even if a state trends heavily toward one party, there is always a substantial population of the other party, and in large states, which means enough people that they'd be a formidable political force anywhere else.
|
|
Biden/Harris
|
Trump/Pence
|
Total
Votes
|
| State
|
Votes
|
Perc
|
Votes
|
Perc
|
| California
|
11,110,250
|
63.48%
|
6,006,429
|
34.32%
|
17,500,881
|
| Texas
|
5,259,126
|
46.48%
|
5,890,347
|
52.06%
|
11,315,056
|
| New York
|
5,230,985
|
60.86%
|
3,244,798
|
37.75%
|
8,594,826
|
| Ohio
|
2,679,165
|
45.24%
|
3,154,834
|
53.27%
|
5,922,202
|
| Massachusetts
|
2,382,202
|
65.60%
|
1,167,202
|
32.14%
|
3,631,402
|
| Mississippi
|
539,508
|
41.06%
|
756,789
|
57.60%
|
1,313,894
|
| Vermont
|
242,820
|
66.09%
|
112,704
|
30.67%
|
367,428
|
Source
The following table lists the number of 250,000-vote markers in the map by candidate and state, and compares this with the actual number of votes. Source
|
|
Biden/Harris
|
Trump/Pence
|
Others
|
Total
|
| State
|
Markers
|
Votes
|
Actual votes
|
Markers
|
Votes
|
Actual votes
|
Markers
|
Votes
|
Actual votes
|
Markers
|
Votes
|
Actual votes
|
| Alabama (AL)
|
3
|
750,000
|
849,624
|
6
|
1,500,000
|
1,441,170
|
0
|
0
|
32,488
|
9
|
2,250,000
|
2,323,282
|
| Alaska (AK)
|
1
|
250,000
|
153,778
|
1
|
250,000
|
189,951
|
0
|
0
|
15,801
|
2
|
500,000
|
359,530
|
| Arizona (AZ)
|
7
|
1,750,000
|
1,672,143
|
7
|
1,750,000
|
1,661,686
|
0
|
0
|
53,497
|
14
|
3,500,000
|
3,387,326
|
| Arkansas (AR)
|
2
|
500,000
|
423,932
|
3
|
750,000
|
760,647
|
0
|
0
|
34490
|
5
|
1,250,000
|
1,219,069
|
| California (CA)
|
44
|
11,000,000
|
11,110,250
|
24
|
6,000,000
|
6,006,429
|
2
|
500,000
|
384,202
|
70
|
17,500,000
|
17,500,881
|
| Colorado (CO)
|
7
|
1,750,000
|
1,804,352
|
5
|
1,250,000
|
1,364,607
|
1
|
250,000
|
88,021
|
13
|
3,250,000
|
3,256,980
|
| Connecticut (CT)
|
4.5
|
1,125,000
|
1,080,680
|
3
|
750,000
|
715,291
|
0.5
|
125,000
|
28,309
|
8
|
2,000,000
|
1,824,280
|
| Delaware (DE)
|
1
|
250,000
|
296,268
|
1
|
250,000
|
200,603
|
0
|
0
|
7,475
|
2
|
500,000
|
504,346
|
| District of Columbia (DC)
|
1
|
250,000
|
317,323
|
0
|
0
|
18,586
|
0
|
0
|
8,447
|
1
|
250,000
|
344,356
|
| Florida (FL)
|
21
|
5,250,000
|
5,297,045
|
23
|
5,750,000
|
5,668,731
|
1
|
250,000
|
101,680
|
45
|
11,250,000
|
11,067,456
|
| Georgia (GA)
|
10
|
2,500,000
|
2,473,633
|
10
|
2,500,000
|
2,461,854
|
0
|
0
|
62,229
|
20
|
5,000,000
|
4,997,716
|
| Hawaii (HI)
|
2
|
500,000
|
366,130
|
1
|
250,000
|
196,864
|
0
|
0
|
11,475
|
3
|
750,000
|
574,469
|
| Idaho (ID)
|
1
|
250,000
|
287,021
|
2
|
500,000
|
554,119
|
0
|
0
|
26,874
|
3
|
750,000
|
868,014
|
| Illinois (IL)
|
14
|
3,500,000
|
3,471,915
|
10
|
2,500,000
|
2,446,891
|
1
|
250,000
|
114,938
|
25
|
6,250,000
|
6,033,744
|
| Indiana (IN)
|
5
|
1,250,000
|
1,242,416
|
7
|
1,750,000
|
1,729,519
|
0
|
0
|
61,183
|
12
|
3,000,000
|
3,033,118
|
| Iowa (IA)
|
3
|
750,000
|
759,061
|
4
|
1,000,000
|
897,672
|
0
|
0
|
34,138
|
7
|
1,750,000
|
1,690,871
|
| Kansas (KS)
|
2
|
500,000
|
570,323
|
3
|
750,000
|
771,406
|
0
|
0
|
30,574
|
5
|
1,250,000
|
1,372,303
|
| Kentucky (KY)
|
3
|
750,000
|
772,474
|
6
|
1,500,000
|
1,326,646
|
0
|
0
|
37,648
|
9
|
2,250,000
|
2,136,768
|
| Louisiana (LA)
|
4
|
1,000,000
|
856,034
|
5
|
1,250,000
|
1,255,776
|
0
|
0
|
36,252
|
9
|
2,250,000
|
2,148,062
|
| Maine (ME)
|
2
|
500,000
|
435,072
|
1
|
250,000
|
360,737
|
0
|
0
|
23,652
|
3
|
750,000
|
819,461
|
| Maryland (MD)
|
8
|
2,000,000
|
1,985,023
|
4
|
1,000,000
|
976,414
|
0
|
0
|
75,593
|
12
|
3,000,000
|
3,037,030
|
| Massachusetts (MA)
|
10
|
2,500,000
|
2,382,202
|
4
|
1,000,000
|
1,167,202
|
1
|
250,000
|
81,998
|
15
|
3,750,000
|
3,631,402
|
| Michigan (MI)
|
11
|
2,750,000
|
2,804,040
|
9
|
2,250,000
|
2,649,852
|
1
|
250,000
|
85,410
|
21
|
5,250,000
|
5,539,302
|
| Minnesota (MN)
|
7
|
1,750,000
|
1,717,077
|
6
|
1,500,000
|
1,484,065
|
0
|
0
|
76,029
|
13
|
3,250,000
|
3,277,171
|
| Mississippi (MS)
|
2
|
500,000
|
539,508
|
3
|
750,000
|
756,789
|
0
|
0
|
17,597
|
5
|
1,250,000
|
1,313,894
|
| Missouri (MO)
|
5
|
1,250,000
|
1,253,014
|
7
|
1,750,000
|
1,718,736
|
0
|
0
|
54,212
|
12
|
3,000,000
|
3,025,962
|
| Montana (MT)
|
1
|
250,000
|
244,786
|
1
|
250,000
|
343,602
|
0
|
0
|
15,286
|
2
|
500,000
|
603,674
|
| Nebraska (NE)
|
1
|
250,000
|
374,583
|
2
|
500,000
|
556,846
|
0
|
0
|
25,044
|
3
|
750,000
|
956,383
|
| Nevada (NV)
|
3
|
750,000
|
703,486
|
3
|
750,000
|
669,890
|
0
|
0
|
32,000
|
6
|
1,500,000
|
1,405,376
|
| New Hampshire (NH)
|
2
|
500,000
|
424,937
|
1
|
250,000
|
365,660
|
0
|
0
|
13,236
|
3
|
750,000
|
790,597
|
| New Jersey (NJ)
|
9
|
2,250,000
|
2,608,335
|
7
|
1,750,000
|
1,833,274
|
0
|
0
|
57,744
|
16
|
4,000,000
|
4,549,353
|
| New Mexico (NM)
|
2
|
500,000
|
501,614
|
2
|
500,000
|
401,894
|
0
|
0
|
20,457
|
4
|
1,000,000
|
923,965
|
| New York (NY)
|
20.5
|
5,125,000
|
5,230,985
|
13
|
3,250,000
|
3,244,798
|
0.5
|
125,000
|
119,043
|
34
|
8,500,000
|
8,594,826
|
| North Carolina (NC)
|
11
|
2,750,000
|
2,684,292
|
11
|
2,750,000
|
2,758,775
|
0
|
0
|
81,737
|
22
|
5,500,000
|
5,524,804
|
| North Dakota (ND)
|
0
|
0
|
114,902
|
1
|
250,000
|
235,595
|
0
|
0
|
11,322
|
1
|
250,000
|
361,819
|
| Ohio (OH)
|
11
|
2,750,000
|
2,679,165
|
12
|
3,000,000
|
3,154,834
|
1
|
250,000
|
88,203
|
24
|
6,000,000
|
5,922,202
|
| Oklahoma (OK)
|
2
|
500,000
|
503,890
|
4
|
1,000,000
|
1,020,280
|
0
|
0
|
36,529
|
6
|
1,500,000
|
1,560,699
|
| Oregon (OR)
|
5
|
1,250,000
|
1,340,383
|
4
|
1,000,000
|
958,448
|
1
|
250,000
|
75,490
|
10
|
2,500,000
|
2,374,321
|
| Pennsylvania (PA)
|
15
|
3,750,000
|
3,458,229
|
14
|
3,500,000
|
3,377,674
|
0
|
0
|
79,380
|
29
|
7,250,000
|
6,915,283
|
| Rhode Island (RI)
|
1
|
250,000
|
307,486
|
1
|
250,000
|
199,922
|
0
|
0
|
10,349
|
2
|
500,000
|
517,757
|
| South Carolina (SC)
|
4
|
1,000,000
|
1,091,541
|
6
|
1,500,000
|
1,385,103
|
0
|
0
|
36,685
|
10
|
2,500,000
|
2,513,329
|
| South Dakota (SD)
|
1
|
250,000
|
150,471
|
1
|
250,000
|
261,043
|
0
|
0
|
11,095
|
2
|
500,000
|
422,609
|
| Tennessee (TN)
|
5
|
1,250,000
|
1,143,711
|
7
|
1,750,000
|
1,852,475
|
0
|
0
|
57,665
|
12
|
3,000,000
|
3,053,851
|
| Texas (TX)
|
21
|
5,250,000
|
5,259,126
|
24
|
6,000,000
|
5,890,347
|
1
|
250,000
|
165,583
|
46
|
11,500,000
|
11,315,056
|
| Utah (UT)
|
2
|
500,000
|
560,282
|
4
|
1,000,000
|
865,140
|
0
|
0
|
62,867
|
6
|
1,500,000
|
1,488,289
|
| Vermont (VT)
|
1
|
250,000
|
242,820
|
0
|
0
|
112,704
|
0
|
0
|
3,608
|
1
|
250,000
|
367,428
|
| Virginia (VA)
|
10
|
2,500,000
|
2,413,568
|
8
|
2,000,000
|
1,962,430
|
0
|
0
|
84,526
|
18
|
4,500,000
|
4,460,524
|
| Washington (WA)
|
9
|
2,250,000
|
2,369,612
|
6
|
1,500,000
|
1,584,651
|
1
|
250,000
|
133,368
|
16
|
4,000,000
|
4,087,631
|
| West Virginia (WV)
|
1
|
250,000
|
235,984
|
2
|
500,000
|
545,382
|
0
|
0
|
13,365
|
3
|
750,000
|
794,731
|
| Wisconsin (WI)
|
7
|
1,750,000
|
1,630,866
|
6
|
1,500,000
|
1,610,184
|
0
|
0
|
56,991
|
13
|
3,250,000
|
3,298,041
|
| Wyoming (WY)
|
0
|
0
|
73,491
|
1
|
250,000
|
193,559
|
0
|
0
|
9,715
|
1
|
250,000
|
276,765
|
| Total
|
325
|
81,250,000
|
81,268,867
|
296
|
74,000,000
|
74,216,747
|
12
|
3,000,000
|
2,896,077
|
633
|
158,250,000
|
158,381,691
|