Spacecraft Debris Odds Ratio
You say this daily walk will reduce my risk of death from cardiovascular disease by 30%, but also increase my risk of death by bear attack by 300%? That's a 280% increased! I'm not a sucker; I'm staying inside.
You say this daily walk will reduce my risk of death from cardiovascular disease by 30%, but also increase my risk of death by bear attack by 300%? That's a 280% increased! I'm not a sucker; I'm staying inside.
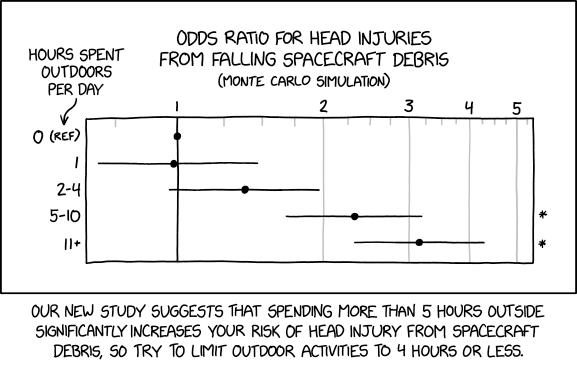
This comic is a misunderstanding of statistics very similar to that of 1252: Increased Risk. It suggests that going outside for more than 5 hours per day significantly increases your risk of head injury from falling spacecraft, and advises to limit outside activity to avoid this risk.
The data are apparently based on a Monte Carlo simulation, a computational method that uses input values randomly drawn from a given distribution and which repeats that calculation many times; the distribution of the outputs is then analyzed. This method is used to determine the possible outcomes (and their respective probabilities) for a given scenario. Basically, instead of doing hard math to calculate the outcomes you let a computer repeat the scenario for a huge number of different input values and watch what happens. In this case, the study might have consisted of defining the baseline probability of spacecraft debris falling from the sky in a given time frame (say, 1% every minute) as well as the probability that it is heavy enough to break through the roof (say, also 1%), translating this to the output of a random number generator (e.g. "1" means "space debris falls in direction of head and can break through the roof", 2-100 means "space debris falls in direction of head but can't go through a roof" and values 101-10000 mean "no danger from space debris"), adding another random number generator to simulate the distributions for "person is outside X hours of the day", then drawing numbers repeatedly from both distributions and calculating the outcome for each instance.
Doing a Monte Carlo simulation for a hypothetical and rare scenario like this can make sense: it is so rare for humans to be struck by spacecraft debris that an absurdly large sample size, involving tens of millions of participants over several decades, would be necessary to obtain significant experimental data. However, the statistical analysis and presentation of the data is horribly misleading and sensationalizing. The comic essentially pokes fun at the way that data can be misrepresented and exaggerated using an example that people would realize is absurdly unlikely.
The results are presented not as an overall probability but rather as an odds ratio of the probabilities. The odds ratio is defined as p(A happens in presence of B)/p(A happens in absence of B), which here would be p(space debris head injury after Xh spent outside and 24-Xh inside)/p(space debris head injury after 24h spent inside). The resulting value tells you how much more likely an outcome becomes if you do (or have) A. E.g. the bottom line of the graph in the comic means that spending 11+ hours outside will make it 3 times as likely to get a head injury from space debris compared to not being outside at all. However, while odds ratios can be useful they tend to hide the scale of a probability - e.g. 0.00000000002%/0.00000000001% = 2, the outcome became twice as likely but the probability only rose by 0.00000000001%. And since the odds of being hit in the head by (any part of) a falling spacecraft are astronomically (no pun intended) low to begin with, even quadrupling it still results in a negligible probability.
The choice of hour brackets instead of a linear time scale is suspicious. Monte Carlo simulations involve a huge number of computations; the scientists should have more than enough data to plot the odds ratio for every additional hour spent outside. Moreover, each hour bracket has a different size - why didn't they use a regular binning like e.g. 1-3, 4-6, 7-9, 10-12? One might suspect that they wanted to conceal inconsistencies and that the underlying data points by themselves don't look nearly as convincing. Moreover, range-based groups of any kind should never be analyzed as if they were independent categories. Spending 5 hours outside is not intrinsically different from spending 1 hour outside - the 5-hour-mark (presumably) doesn't suddenly turn humans into space-debris magnets. The likelihood of space debris falling down at any given moment stays the same and the cumulative (i.e. summed-up) probability should increase at a constant rate. Instead of comparing every hour bracket to the same baseline reference, each should each be compared to the next-lowest value.
The error bars (the lines extending from the points in the graph) are HUGE compared to the effect they measured. Error bars define the range in which the true value might be - here, for 2-4 hours the true value could be an increase by 2, or a small DEcrease of the probability.
The data are shown on a log scale. Logarithmic scales are used when you have both very small and very large values and want to depict their relative differences in a single plot without making the small values look like zero or cutting off the large values. The data shown here do not have huge differences - there is no good reason for using a log scale. However, the log scale is conveniently chosen to make the error bars look like they have the same length. They do not. The error bar for the last data point is actually twice as large as that for the first data point.
The title text continues the misuse of statistics by insinuating that a 30% decrease of cardiovascular disease resulting from going outside (and exercising) is outweighed by a simultaneous 300% increase of risk of being killed by a bear. As shown in 1102: Fastest-Growing, the percentage increase/decrease alone of something has little meaning; the context of the original size is needed to evaluate how impressive the change really is. And in this case, the probability of dying from a cardiovascular disease is much, MUCH higher than the probability of being attacked and killed by a bear, so the moderate decrease of the former has much more impact on one's overall life expectancy than even a huge increase of the latter (unless you live in an area that has many bears, in which case your best bet is to take appropriate precautions rather than to never go outside at all).
The "280% increase" of the title text is also an error, though perhaps not for reasons you might assume at first glance (the correct calculation is not "300% − 30% = 270%"). To "increase by 300%" means to add 300% on top of the original 100% (=400%, so multiplied by 4), while to "decrease by 30%" means to remove 30% from the original 100% (=70%, so multiplied by 0.7). Combining these (which is very very wrong!) would mean multiplying by both, for an overall change of 4.0 × 0.7 = 2.8, or 280%. However, this should be read as an increase to 280% of its old value, not by 280% (you started at 100% and added 180%). But this is a very, very wrong way of doing the math because these are probabilities of very different things with very different scales (if you threw out 30% of your dishware but in that same period also acquired 3 toothpicks on top of your original 1 toothpick, would you say that your kitchen stuff increased by 180%?). The correct way of combining the two probabilities would be to translate them onto the same scale - the overall chance of death - which would be done by multiplying each value with its probability of happening at all. For example, if the chance of dying from cardiovascular disease was 50% and the chance of being killed by a bear was 0.1%, the overall chance of dying from either would be the sum, 50.1%. Both probabilities are affected by going outside; the new chances are now 50%*0.7=35% and 0.1%*4=0.4% and the combined chance of dying from either is now 35.4% - a significant DEcrease from the original 50.1%.
The specific reference to falling spacecraft is likely inspired by events happening around the time of this comics release (March 2022). Around a month before this was posted, the head of the Russian space agency, Roscosmos, warned that sanctions against Russia (mostly those over the 2022 Russian invasion of Ukraine) could result in the International Space Station crashing. Since the Russian section of the space station is the one that provides propulsion (although it is built to rely on the power generated by the other sections), this was taken seriously and as of when this was posted, NASA was trying to come up with alternative stabilization strategies in case the situation worsened. There was also a recent report of some 600 kg space rocket debris found in Brazil.