Change in Slope
Squinting at a graph is fine for getting a rough idea of the answer, but if you want to pretend to know it exactly, you need statistics.
Squinting at a graph is fine for getting a rough idea of the answer, but if you want to pretend to know it exactly, you need statistics.
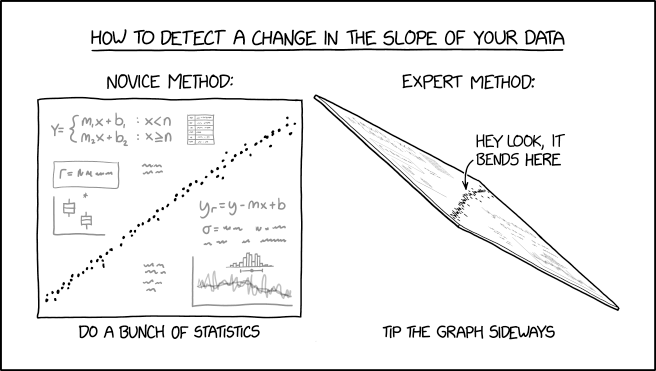
The comic is a tip for detecting changes in slopes over a scatter plot of data. This is a common requirement in exploratory statistics for comparing trends in a series — finding the cutoff where the slope changes may reveal valuable information about the data.
The comic compares two methods. Firstly, a novice method — by 'doing a bunch of statistics'- i.e, applying various statistical tools to analyze the data and figure out the quantitative change in slope. This results in two equations for the trendlines above and below a given value, a box plot, a histogram, and a line chart. It is unknown exactly what methods the novice used to figure out the change in slope in the data. Possibilities include calculating the derivatives (which probably won't work well on noisy data such as shown), or gradients, or using a Savitzky-Golay filter or piecewise linear smoothing spline fits. Randall's light gray figures may be suggesting this method.
The other is the so-called 'expert' method, which involves tilting the page the graph is printed on to view changes in slope better. For small changes in an underlying trend, similar to that apparently shown in the comic, direct visual inspection cannot always identify or even reveal the effect. The comic shows, however, that by taking the page and rotating it in just the right way, the foreshortened perspective can make certain details much more apparent, allowing the 'expert' to see at a glance that there is a change in the slope. Ironically, tilting the comic to make the original roughly resemble the perspective of the 'tilted' version graph shown in the comic shows that the right-hand panel is slightly exaggerated for visual effect. The use of perspective to make information pop into the audience's view has been used by artists for centuries.
However, applying such an approach to data plots can run into errors — the primary one being parallax error from the oblique viewing angle causing the observer to not necessarily identify or clearly find the point at which the slope changes. It also does not reveal any data about the quantitative value of the change in slope, merely proving the existence of one. Furthermore, noisy data might show an apparent slope change that is not representative of an actual change in the underlying data, so even more advanced statistics testing the hypothesis of whether an apparent slope change is real may likely be a good idea.
The title text then goes on to say that, while such a trick is useful to identify that there is some change in slope, in order to pretend to know it exactly one must revert to statistics (the "novice method") to obtain some form of information, defeating some of the premise of the comic. This at least produces a semblance of statistical rigor although, once an answer appears obvious, data could be interpreted to reach an answer that you are now expecting rather than revealing something of more statistically useful significance.