Data Point
In general you should only include your single best data point in the paper. The rest of the data can go in the supplementary materials.
In general you should only include your single best data point in the paper. The rest of the data can go in the supplementary materials.
When scientific measurements are made, the conclusions are almost always based on many data points observed in relation to each other. The comic jokes that a single data point can somehow be of such interest in isolation that the other data may be disregarded. In reality, a single datum can almost never represent what the information in the related data taken together indicate.
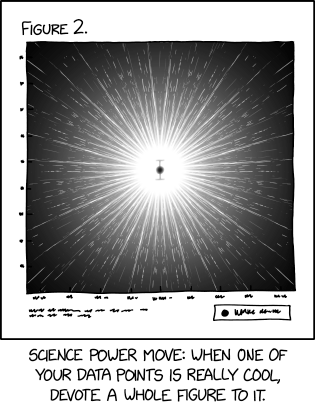
Randall's caption states that a figure illustrating a single datum thus constitutes a "science power move." (Similarly to the science tips of previous comics.)
This is most likely intended as facetious satire,[citation needed] because the purpose of a chart or graph figure is to present multiple data which would be less clear as tabular or textual data, so there is rarely any reason to devote a figure to a single datum, regardless of its importance. The canonical counterexample is presentation of the mean of a group of measurements. (Figure here — note the point's specular reflection indicating 3-D.) A less common counterexample might be when an interesting singular matrix decomposition such as an eigenvector is characterized, but this would only occur when such a datum is highly dimensional. It also could be a joke about papers which only highlight particularly interesting or significant data without including the background measurements or similar mundane information necessary to fully understand or reproduce the findings. While there are accepted reasons for this practice, it can be annoying when trying to follow an otherwise useful procedure or comparing aspects of the results the authors did not anticipate.
The title text suggests relegating all the other data to supplementary materials, presumably to avoid detracting from the single "cool" datum.