Tick Marks
If you're really savvy, you can hide an entire set of illicit transactions by timing them to draw what looks like a graph inset.
If you're really savvy, you can hide an entire set of illicit transactions by timing them to draw what looks like a graph inset.
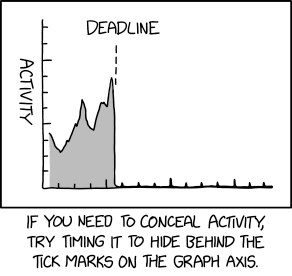
This comic provides the reader with a suggestion on how to "conceal activity" — specifically, in this case, activity happening after what should have been the deadline for completing it — that is going to be graphed over time, by timing bursts of activity to coincide with the ticks on the time axis. This is assuming that the scale of the time axis is known, that the ticks are placed inside the axis line, and that the "bottom" of the graph is aligned with the line on which the ticks are drawn, rather than the "peak" of the largest tick.
Theoretically, the graphed "activity" would be concealed behind the ticks, meaning anyone reading the graph would perceive activity as having ceased at the deadline, even though it had continued in time-axis-tick-sized bursts afterwards. In practice, this would be extremely difficult to do, since it may be impossible to predict what scale the graph might use and the intervals used for major and minor tick marks. Only if the chart designer used the same, consistent and predictable axis tick marks each time the chart was generated and refreshed, would this technique of hiding data amongst the axis tick marks be feasible. Software such as Microsoft Excel may have automatic axis algorithms which may change the scaling and the position of the tick marks when generating charts. If the "hidden" data and the tick marks didn't align, you would get a Moiré effect, which would likely lead to someone becoming suspicious and discovering the hidden data.
The title text continues with tips on how to make illicit transactions by integrating them in such a manner that makes them appear to be (or merge into) a graph inset, which would contain relevant information to the graph. For this to work convincingly, it would probably have to be a scatter plot or similar, rather than a bar chart or line chart, upon which carefully crafted datapoints could 'draw' a credible facsimile of graphical meta-features. This reference is timely because the comic came out during tax season, a period when many[citation needed] Americans need to find an explanation for illicit transactions or sources of revenue.
Variations (or possibly inversions) of pretending that actual data is part of the graphical framing device have also been previously seen in the form of flags.